Politics
Politics
Out of context: Reply #14289
- Started
- Last post
- 33,777 Responses
- ********0
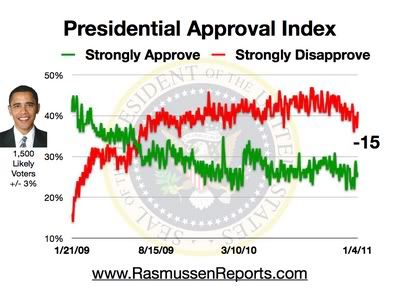
I was looking at these poll numbers today from the two most
"respected" American pollsters. There seems to be a somewhat different trend being portrayed here lolAnd statistically speaking, its almost impossible to poll people everyday and get a 15 point difference in opinion. So, which reality do you believe in?
- i don't get why people pay attention to poll numbers. bout as cool and accurate as maxim top 100********
- Actually you're wrong though deathboy. If you sample enough people polling is almost always accurate.********
- im not talking about statistics errors and such. what use is that info to me? to you? does poll data change your mind?********
- and then toss in statistic errors, demographics, bias and you see its probably not even wroth it to PR cats.********
- hell all that is important to PR cats is how its spun not the data. Good news to rally teams is all its really good for********
- Aren't the one who recommended that book on public opinion/ propaganda a few weeks back?********
- Cmon...where did all the cynicism go son?:)********
- Anyway, you're talking about two different things. Are polls accurate and are they used PR or political reasons.********
- Just saying i see no substance or use. Just a bad ad i normally ignore.********
- how bout this get the data taken on every person polled on both parts and methods used and we can find an answer********
- answer********
- How bout we don't and say we did********
- But you're missing the point. It's not actually that complicated:)********
- i know. its retarded. how does one decide which one is mor eliekly correct not knwoing how the data was used...********
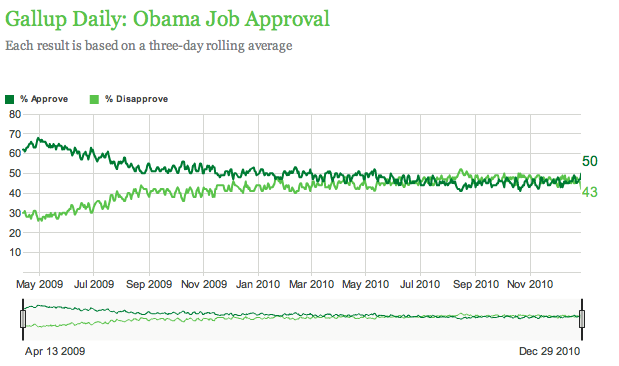
- No, the I was trying to make is that the data is actually almost the same.********
- Look at the bottom two graphs and the start and end numbers. Almost identical in fact.********
- He then takes that data, which is the same as Gallup's, and comes up with some justification from throwing out enough people that it looks like the one at the top.********
- people that it results in the one at the top:) Making it seem like there are these two equally valid interpretations.********
- oh alright. .. haha im actually looking at the graphs and have no idea/how what theyre showing to make any sort of decision on that********
- One in which Obama is supported by only 20% of the country and mobs of Patriotic Tea Partiers are swarming through the streets********
- through the streets or something...lol********
- sens or opinion on any of it. i got nothign accept both could be wrong or soemthign could be biased. i have no idea or care about public opinioned summed up in such totality********
- concern with the public opinion summed up into approve/disapprove. . what does that mean ?!********
- my head hurts now thinkign so hard about nothing********
- i don't get why people pay attention to poll numbers. bout as cool and accurate as maxim top 100