Official Infographics Thread
Official Infographics Thread
- Started
- Last post
- 376 Responses
- uan0
- uan-1
World Container Traffic and Throughput, 1980-2013 (millions of TEU)

- chukkaphob0

- Watch that shit turn dark blue over the next 20 years.HAYZ1LLLA
- map, not an infographic.futuremongolian
- a map is an infographic.akiersky
- Cheap labor.Maaku
- chukkaphob3

- lolfadein11
- haha!Krassy
- lolmoldero
- Thats my handwriting!cannonball1978
- imbecile2
- east side needs to learn how to drivePonyBoy
- Fuck YEAH MIAMI!CALLES
- east side has road layouts that were designed for horse and carriagesterry_cloth
- bklyndroobeki-2
- posts dead link,
http://conduit1.com/…
doesn't bother posting correct one_niko - niko are you unable to see it?bklyndroobeki
- posts dead link,
- mg333
This is really outstanding. It's a big interactive infographic page about millennials and their spending habits.
- sarahfailin1
- via GeorgesIII news o' the day link
- bklyndroobeki0
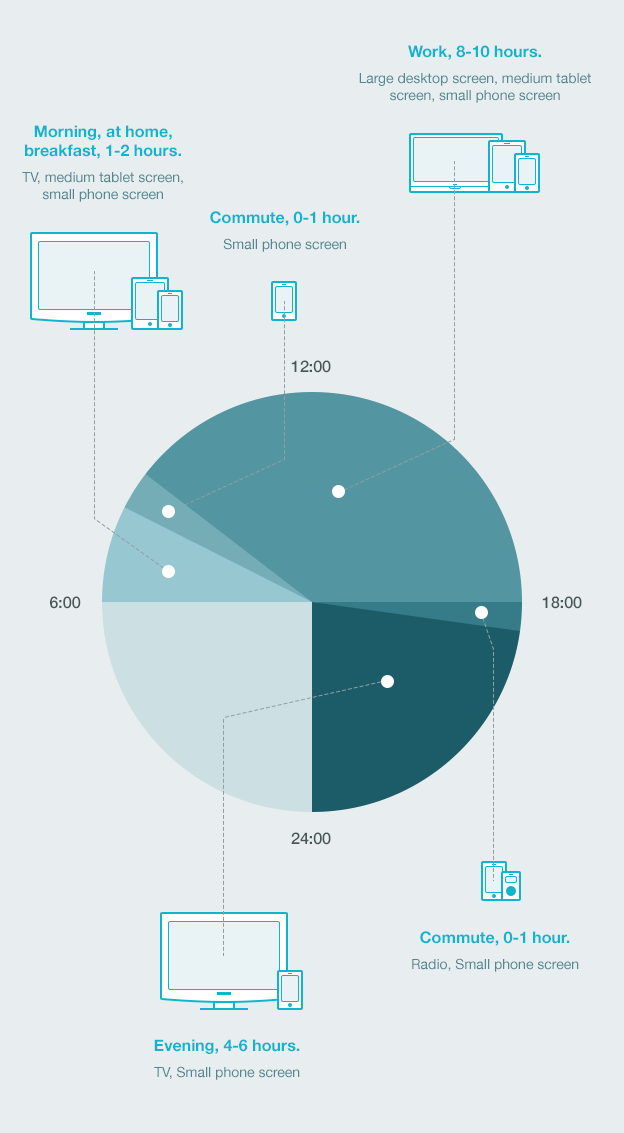
- accurate but who wakes up at 6am?Beeswax
- No calculations about when on teh pooprbklyndroobeki
- bklyndroobeki0

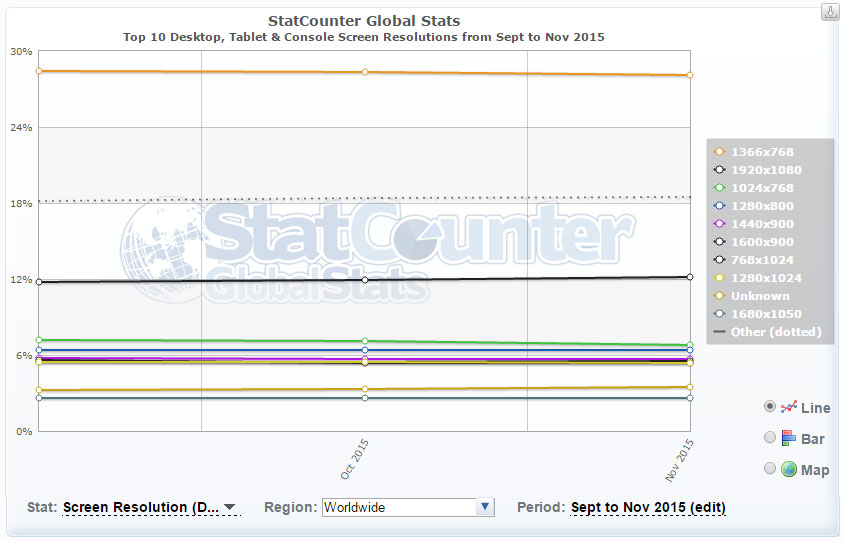
- http://blog.usabilla…bklyndroobeki
- lol—hubris for the salesman who needs something to bolster their pitch when they go to sell the client something they more than likely don't understnd thmselvesPonyBoy
- can't we stop w/all the dumb acronyms and get back to simply calling it 'design'? 'good design' handles ALL this bullshit... it's really just common sensePonyBoy
- Krassy1
- LOL! I scrolled and saw only this and said "hey wait, that's a totino..."
http://i.imgur.com/6…kona
- LOL! I scrolled and saw only this and said "hey wait, that's a totino..."
- Projectile0

- If true... fascinating.wagshaft
- Very interesting. Although researched just one year. 1972 because it looks like the worst year the UK had. Seems bollox.HAYZ1LLLA
- https://en.wikipedia…HAYZ1LLLA
- The irish.wagshaft
- bklyndroobeki0
oh, “the job of a product manager is to help your team (and company) ship the right product to your users.”
http://blog.alpha-ux.co/product-…